
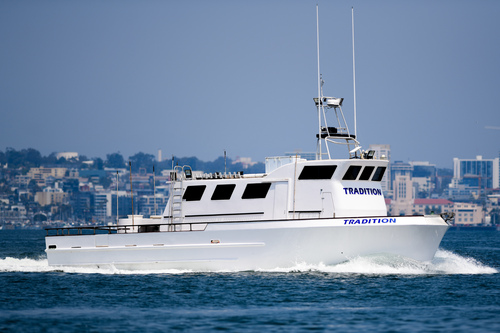
Tradition - California Yellowtail by Month - 2026
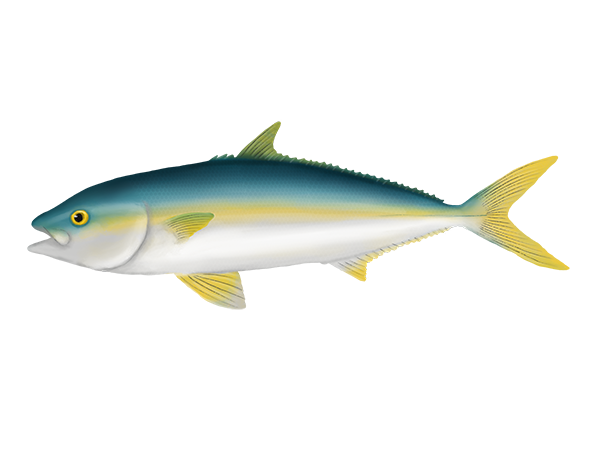
235 California Yellowtail caught
over 4 months in 2026 (9 trips,
206 anglers).
California Yellowtail caught by month · 2026
Tap a month to see the individual trips.
| Month | Trips | Anglers | Caught | Fish / Angler |
|---|---|---|---|---|
| ▸ Jun | 3 | 59 | 94 | 1.59 |
| Sat, Jun 13Full Day Coronado Islands | 19 | 62 | 3.26 | |
| Sun, Jun 14Overnight Trip | 22 | 26 | 1.18 | |
| Sun, Jun 211.5 Day Trip | 18 | 6 | 0.33 | |
| ▸ Jul | 2 | 52 | 20 | 0.38 |
| Sun, Jul 12Full Day Trip | 22 | 1 | 0.05 | |
| Sun, Jul 19Overnight Trip | 30 | 19 | 0.63 | |
| ▸ Aug | 3 | 78 | 117 | 1.50 |
| Sun, Aug 2Overnight Trip | 25 | 60 | 2.40 | |
| Sat, Aug 22Overnight Trip | 25 | 45 | 1.80 | |
| Sat, Aug 29Full Day Trip | 28 | 12 | 0.43 | |
| ▸ Sep | 1 | 17 | 4 | 0.24 |
| Fri, Sep 182 Day Trip | 17 | 4 | 0.24 | |
| Total | 9 | 206 | 235 | 1.14 |

www.SanDiegoFishReports.com © 2026. All Rights Reserved.
Website Hosting and Design provided by TECK.net
Website Hosting and Design provided by TECK.net
All fish illustrations are provided by FishDatabase.com and are copyright‑protected. Please don't reuse them — sign up for the FishDatabase API.